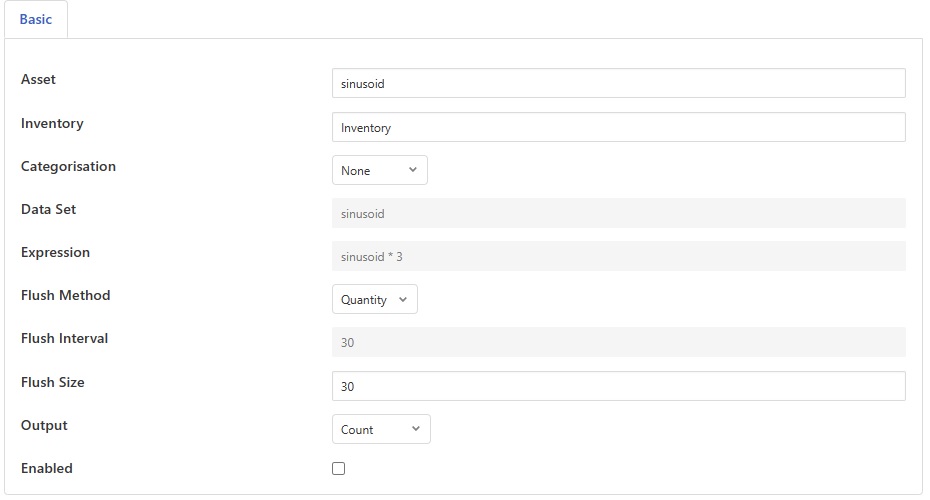
Inventory Filter
The flir-filter-inventory filter provides a mechanism for cataloging the data that flows through a pipeline. It counts data and reports on the number of readings for an asset that pass through the filter. It can also count readings with particular values in the reading or all readings for the asset
The typical use of this filter is to enable a system to easily determine of it is collecting a good spread of data. This can be used for example when training a machine learning algorithm to ensure that a good spread of conditions are being capture to give the model sufficient examples of the data it might encounter when running.
Filter Configuration
|
The configuration options supported by the inventory filter are detailed in the table below
Asset: The name of the asset to inventory.
Inventory: The name of the inventory asset to write.
Categorisation: Select how to categorise the data that is inventoried
None: All the readings are counted in a single category, only updating the total value in the inventory reading
Data Set: Categorise base on the value of a particular data point in the readings.
Expression: Categorise based on the result of an expression.
Data Set: The name of a data point that is used to define the data set that is captured. This is only valid if Categorisation is set to Data Set.
Expression: The expression to evaluate if the Categorisation is set to Expression. This is a mathematical expression that is evaluated on numeric data in the assets.
Flush Method: This defines the method the plugin uses to flush data, i.e. write the inventory asset.
Quantity: Flush based on the number of readings inventories in total.
Time: Flush periodically regardless of the number of readings inventoried.
Flush Interval: The time in seconds between the filter writing an inventory asset. Only valid for time based flushing.
Flush Size: The number of readings that should be inventoried before a flush operation occurs. Only valid if the quantity based flush method is used.
Output: A selection list that defines the data set values that are output. Possible values are Count or Percentage.
Filter Output
The filter will output an reading with an asset id as defined by the Inventory configuration item. That asset will have a number of datapoints. One of these is called Total and is a total of the number of readings seen with the given asset id.
There will also be a datapoint for each of the items in the chosen data set. The name of these is the value of the data set items.
On output the counts are reset to 0.
If the output option is set to Percentages, rather than counts being output for each of the data set values, then a percentage of the total in the current report is output. The Total however Will never be a percentage, it is always a count.
Data Sets
Data sets are used to categorise the data in the pipeline. They may be defined either as the set of values a particular datapoint may hold or the result of a mathematical expression.
A typical use of a dataset is to inventory how many readings have been capture when the machine that is being monitored is in a given state. This allows us to ensure we have collected a representative sample of data for each known machine state.
An example of this might be a pipeline to capture vibration data for training a machine learning model. Consider we have a pipeline that is capturing vibration data into an asset called vibration and plc data into a PLC asset. We can use the flir-filter-labelling plugin to add labels to the vibration data based on states calculated from the PLC data. For the sake of this example will say this state is written into a data point called stateLabel. We can then define this plugin with the following configuration.
Item |
Value |
Description |
|---|---|---|
Asset |
vibration |
The vibration assert we wish to inventory |
Inventory |
inventory |
We write the inventory out to an asset named inventory |
Categorisation |
Data Set |
We are categorising based on a label value |
Data Set |
stateLabel |
We are using the data point stateLabel to define the data set members |
This will cause the filter to count each of the distinct values of the stateLabel data point observed in the pipeline.
In our example, if the stateLabel can have values of idle, spinning up, operating, spinning down, then the output inventory readings will have counts for each of these states. In this case the reading would have the following datapoints
Total |
100 |
idle |
11 |
spinning up |
17 |
operating |
67 |
spinning down |
5 |
Note
The data set names are collected as data is read, therefore it is possible that not every inventory output will have values for every possible value of the controlling data set asset. For example the spinning down state may not yet have been observed in the data stream and will therefore not be present in the output. Once seen in the data stream however a value will be present in all future outputs even if the count for the current data collected is zero.
